
From Event to Insight: How MetaFrazo Turns Every Jira Action Into Operational Intelligence
 Maria Reisinger·2026-07-31·5 min read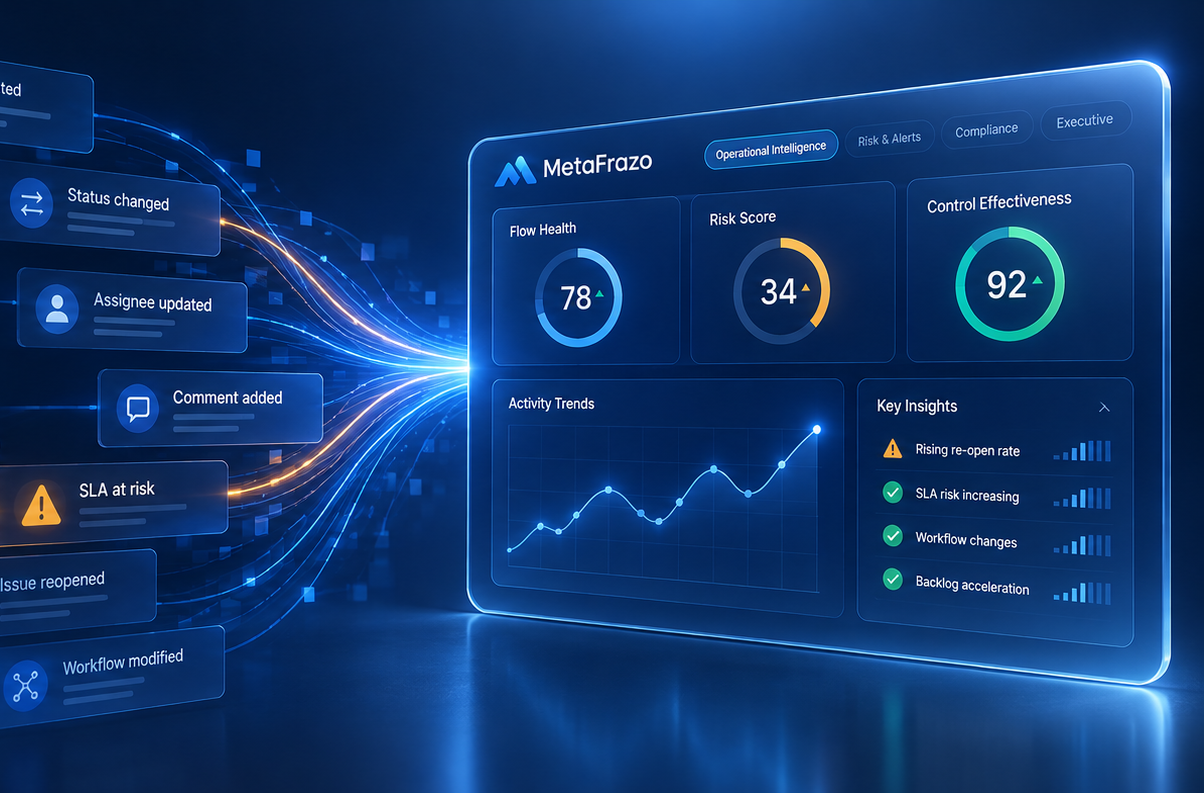
Every day, your teams generate thousands of signals inside Jira. Someone opens an issue on a desktop, a project manager changes a status from a laptop, a stakeholder checks progress from a phone. Individually, each of these actions is trivial. Collectively, they are the most accurate, real-time picture of how your projects are actually running, and in most organizations that picture is never assembled.
MetaFrazo exists to close that gap. It captures the full stream of Jira activity end to end and transforms raw clicks into dashboards, alerts, and compliance reports that administrators can act on immediately. Here is how the pipeline works, step by step.
The full flow at a glance
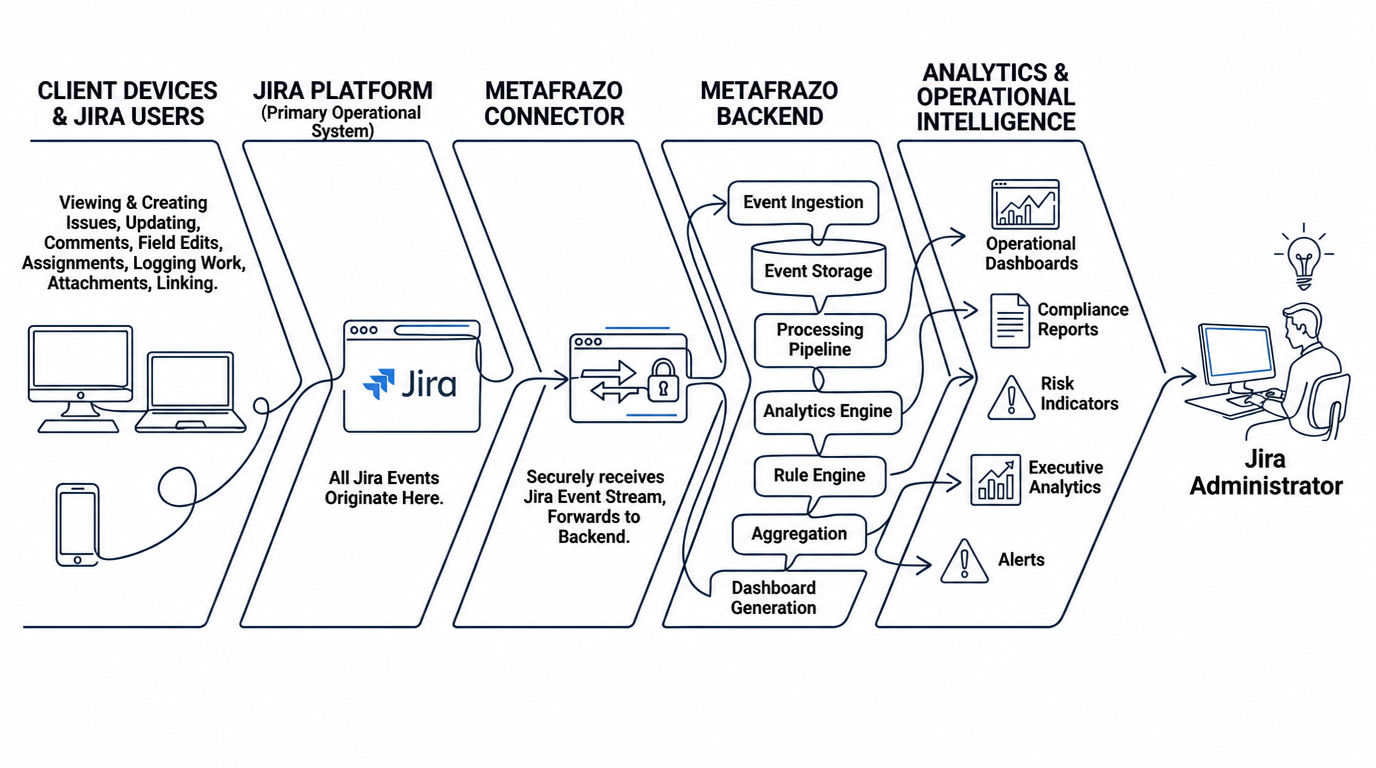
Every meaningful action taken inside Jira, by any user and on any device, becomes a structured event. MetaFrazo captures that stream continuously through four connected layers: user activities flow into the Jira event stream, which is picked up by the MetaFrazo Connector and passed to backend processing. The pipeline runs without interruption. No event is lost, no action goes untracked, and every click becomes a data point in your operational intelligence layer.
Step 1: Users and devices, where the stream begins
Jira is accessed across a wide spectrum of devices, and every touchpoint is an origin for your event stream. A developer triaging bugs on a desktop, a project manager updating statuses on a laptop, a stakeholder checking progress on a smartphone: each interaction counts. Desktops serve as the primary workstations for complex workflows, laptops give team leads flexible access across locations, and smartphones keep field teams and stakeholders connected on the go. Wherever the work happens, that is where the data is born.
Step 2: The user actions that generate events
Every meaningful gesture inside Jira produces a discrete, structured event. These are not passive log entries; they are rich signals that carry context about who acted, on what, and when. Nine primary action types drive the majority of your event volume:
-
Opening or viewing an issue tracks engagement and visibility: who is watching what, and when.
-
Creating an issue measures intake rate and backlog growth over time.
-
Changing issue status captures workflow transitions, exposing bottlenecks and cycle time.
-
Assigning an issue reflects workload distribution and team capacity signals.
-
Adding a comment records collaboration activity and communication density.
-
Editing a field signals data quality management and ongoing refinement.
-
Adding an attachment indicates documentation habits and evidence collection patterns.
-
Linking issues exposes dependencies and relationship maps across the project graph.
-
Logging work provides the actual effort data essential for capacity and billing analysis.
Each of these carries meaning far beyond the action itself. Together, they form the raw material of operational intelligence.
Step 3: Jira as the event origin
Jira sits at the heart of the pipeline. As the system of record for all project activity, it generates a continuous, structured event stream each time a user action occurs. Crucially, these events are not sampled. They are comprehensive and real-time, capturing every state change across every project, board, and issue in your instance. Every action triggers an event immediately, with no polling delays or batching latency. Each event carries a rich payload: actor, timestamp, project, issue type, and change delta. All nine action types are captured, across every project and every user.
Step 4: The MetaFrazo Connector
The Connector is the bridge between Jira's native event stream and the MetaFrazo intelligence backend. It subscribes to Jira's webhook and event API layer, receiving every event in real time and forwarding it reliably, without data loss, duplication, or transformation artifacts. By design it is lightweight, imposing no performance overhead on your Jira instance.
On the way in, the Connector receives raw event payloads from all action types, along with user identity and session context, issue metadata and project scope, and timestamps and change deltas. On the way out, it forwards a validated, deduplicated event stream: normalized payloads ready for ingestion, delivered as a continuous feed with no batching and no lag, over a secure, authenticated channel to the MetaFrazo Backend.
Step 5: Backend processing, from raw data to meaning
The MetaFrazo Backend is where raw event data becomes intelligence. Before any output is produced, the incoming stream passes through four core operations, ensuring that what reaches administrators is signal, not noise.
First, process: each event is parsed, validated, and enriched with contextual metadata. Second, analyze: rules, patterns, and anomaly detection are applied across the stream. Third, aggregate: events are grouped by user, project, issue type, time window, and workflow stage. Finally, transform: those aggregated signals are converted into operational intelligence outputs. Only after all four steps does anything surface to an administrator.
Step 6: Outputs, six ways data becomes intelligence
The backend produces six categories of output, each serving a distinct administrative or operational need. Dashboards give live views of team activity, velocity, and project progress. Analytics deliver deep-dive reports on cycle time, throughput, and user behavior. Risk indicators provide early warnings on blocked issues, overdue items, and capacity stress. Compliance reports offer audit-ready logs of who changed what and when, built for governance teams. Operational insights surface patterns and recommendations from aggregated event history. And alerts send proactive notifications the moment a threshold is breached or an anomaly appears. Together, they give administrators a 360-degree view of project health, risk, and compliance, derived entirely from the native event stream.
Step 7: The administrator gains insight
At the end of the pipeline sits the Jira Administrator, the human decision-maker who benefits from everything MetaFrazo has processed. Instead of manually sifting through raw issue logs or exporting spreadsheets, the administrator sees purpose-built dashboards that surface only what matters: the risks to address, the trends to act on, and the compliance posture at a glance.
The contrast is stark. Before MetaFrazo, administrators manually query logs, build ad-hoc reports, and react to problems after the fact. After MetaFrazo, they see real-time operational intelligence and act proactively, before issues escalate.
The moment raw Jira events become a clear dashboard view is the moment data becomes a decision. MetaFrazo closes that gap automatically.
The complete event-to-insight flow
From the first click on a device to a meaningful insight on an administrator's screen, the entire pipeline is continuous, automated, and comprehensive. Nine core action types are captured and forwarded. Processing is real-time, with no batching and no delays. And six output categories, dashboards, analytics, risks, compliance, insights, and alerts, are all derived automatically.
Every user action matters. Every event is captured. Every insight is earned.
Rate this post
Related articles
How to Detect Workflow Bypass in Jira
Skipped reviews look exactly like speed on a velocity dashboard. How the Bypass Risk Score turns workflow events into one number per project.
2026-08-14
Atlassian Analytics and Jira Governance: Who Owns the Query?
Every audit asks the same Jira questions, and nobody owns the query. What Atlassian Analytics offers, who it is built for, and where MetaFrazo adds to it.
2026-09-28
5 Questions in the Atlassian Universe with Martin Runge
Martin Runge, Head of Atlassian Practice at XALT, on how long Jira actually remembers who changed what, why backup is more the customer's job than most Cloud teams realize, and what separates a logged change from an authorized one.
2026-09-10